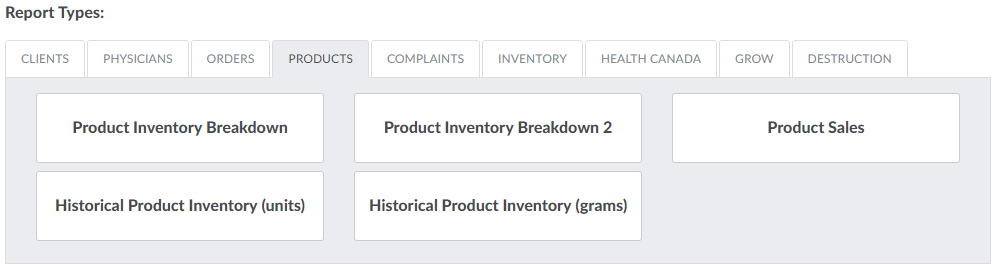
Enter the Reports module, and open the Products tab in the Report Types section to access Product reports. Product reports track product inventory and sales information. Hover over a report heading to view the report's mandatory and optional filter fields, and click on the report heading to generate the report, in CSV format.
Data in the reports is refreshed once daily. Historical reports display information on the day's opening inventory at 8:00 am local time, while standard reports display information based on snapshots taken at midnight.
Note*: Generating a report with a large date range may take several minutes while data is collected. Try downloading reports periodically or wait until off hours for report generati*on.
Ample Organics currently offers five distinct Product reports:
- Product Inventory Breakdown
- Product Inventory Breakdown 2
- Product Sales
- Historical Product Inventory (units)
- Historical Product Inventory (grams)
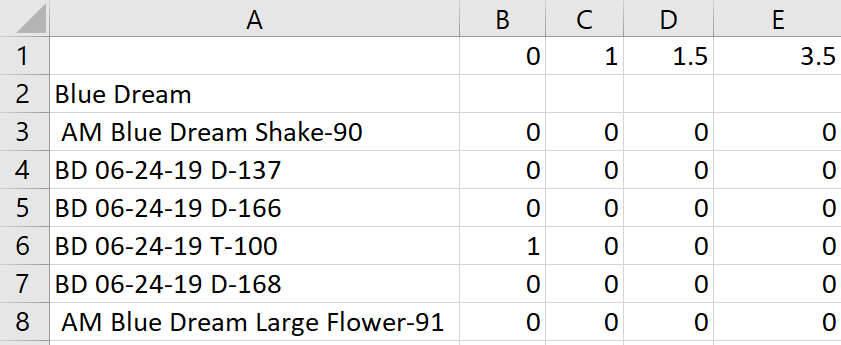
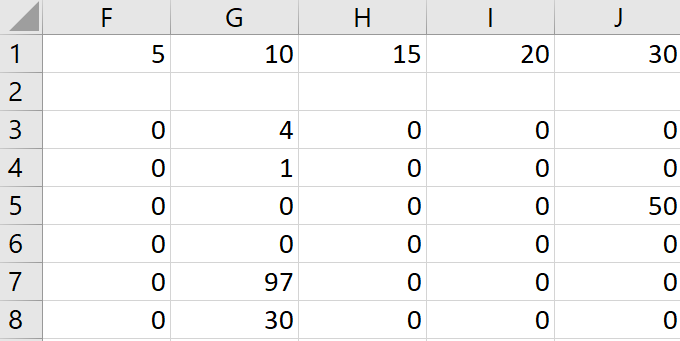
Product Inventory Breakdown
An inventory breakdown of each product, SKU–or Stock Keeping Unit–and Packaging Run. Cross-reference this report with the Prescription Tracker report, a Client Report, to determine if inventory supply meets prescription demand.
-
Required Filter Fields: None
-
Optional Filter Fields: None
-
Order: By default, the report lists product inventory items in ascending order by
Product—>SKU—>Packaging Run, and the net weight per SKU. -
Data Points Pulled:
-
Product—>SKU—>Packaging Run
-
Number of SKUs with a net weight of 0 grams
-
Number of SKUs with a net weight of 1 gram
-
Number of SKUs with a net weight of 1.5 grams
-
Number of SKUs with a net weight of 3.5 grams
-
Number of SKUs with a net weight of 5 grams
-
Number of SKUs with a net weight of 10 grams
-
Number of SKUs with a net weight of 15 grams
-
Columns will continue incrementally up to the highest net weight of all SKUs in the licence holder's inventory.
-
-
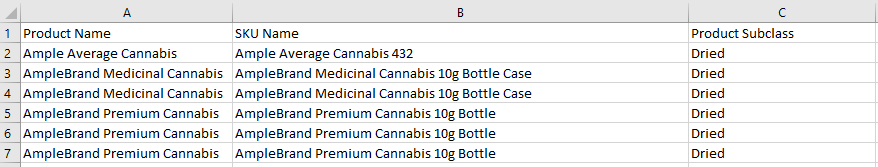
Product Inventory Breakdown 2
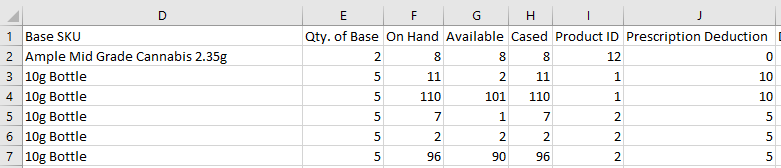
An inventory breakdown of each product and SKU–or Stock Keeping Unit–with comparison of units on hand versus units reserved. This report can be generated to determine if inventory supply meets demand.
-
Required Filter Fields: None
-
Optional Filter Fields: None
-
Data Points Pulled:
-
The product's name
-
The SKU's unique name
-
The product's subclass
-
The Base SKU
- This only applies if the SKU is a Case SKU.
-
Quantity of base units per case
- This only applies if the SKU is a Case SKU.
-
The SKU's quantity of On Hand units
- This refers to total packaged units in the inventory, whether or not they have been released for sale.
-
The SKU's quantity of Reserved units
- This refers to the quantity of units requested in orders that have not yet been fulfilled.
-
The SKU's quantity of Available units
- This refers to packaged units that have been released for sale.
-
The SKU's quantity of Cased units
-
The SKU's prescription deduction
- This refers to the number of grams a single unit will deduct from a client's prescription allowance.
-
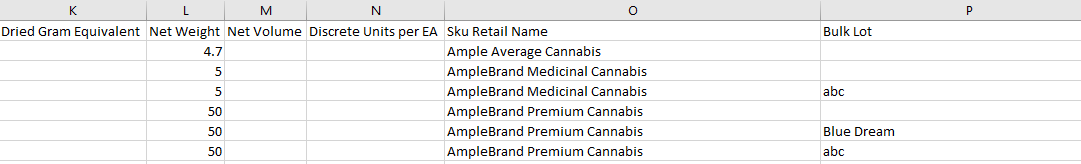
The SKU's net weight, in grams
-
The SKU's net volume, in volume
-
The SKU's quantity of discrete units per EA unit
-
The SKU's unique retail name
- This may be different from the SKU's internal name
-
The Bulk Lot associated with the SKU
-
Product Sales
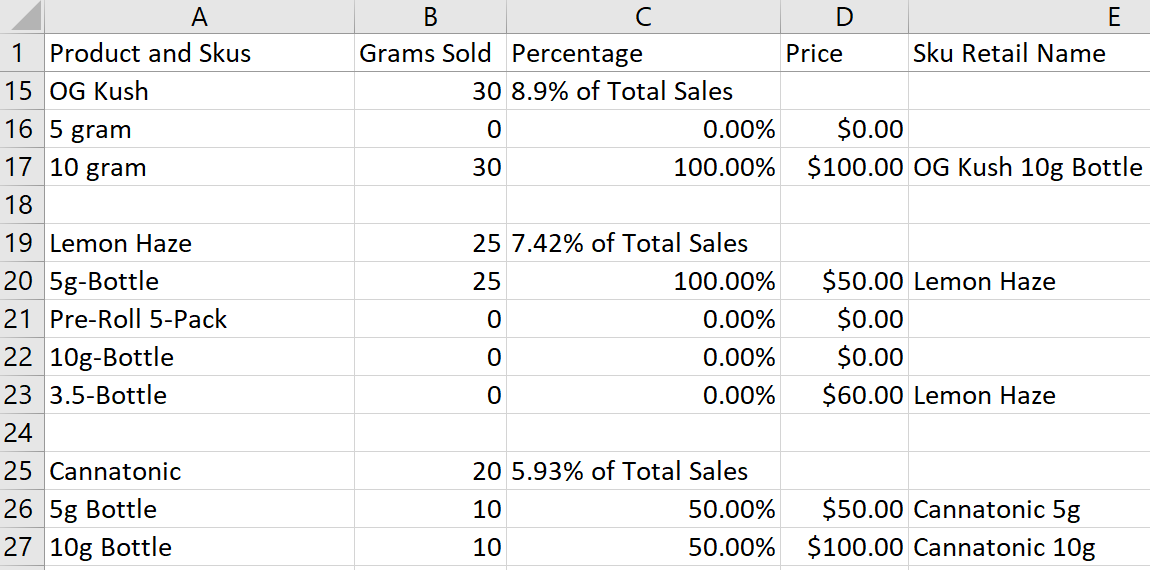
A general overview of all products and SKUs–or Stock Keeping Units– sold, including the total grams sold, the price of each SKU, and percentage of total sales each SKU is responsible for. If desired, specify a date range for the report.
-
Required Filter Fields: None
-
Optional Filter Fields: Start and End dates, and Referral Code may be used to filter report results.
-
Order: By default, the report lists each product and the product's SKUs in descending order by the product's Percentage of total sales.
-
Data Points Pulled:
-
The product, followed by each of the product's SKUs
-
Total weight–in grams–of the product sold, followed by grams sold per SKU
-
Product's sales as a percentage of total sales followed by per SKU sales as a percentage of the product's sales
-
Price per SKU
-
The SKU's retail name
-
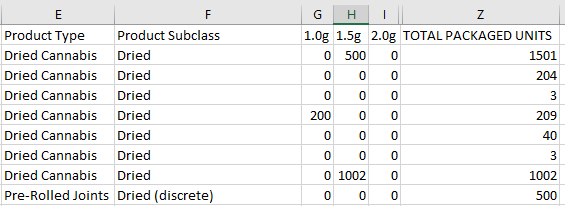
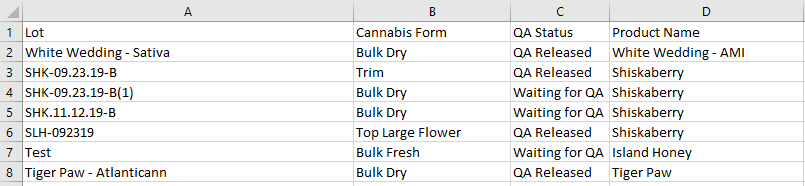
Historical Product Inventory (units)
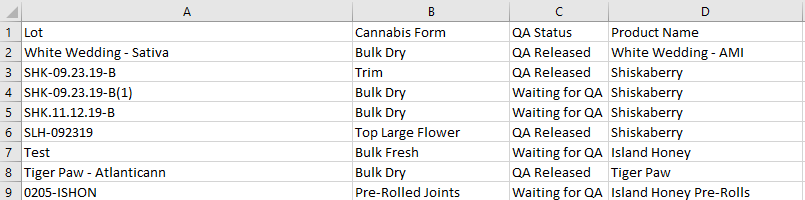
A summary of the packaged inventory (in units) in stock on a given day, sorted by the associated Bulk Lot.
-
Required Filter Fields: None
-
Optional Filter Fields: Start Date
-
Data Points Pulled (per product):
-
The Bulk Lot
- This serves as the source of the packaged inventory.
-
The Bulk Lot's Cannabis Form
-
The Bulk Lot's QA Status
-
The associated product's name
-
The associated product's type
-
The product's subclass
-
Total units in stock per SKU, sorted by net weight
- The report will include a column for each net weight setting.
-
The total units of the product packaged
-
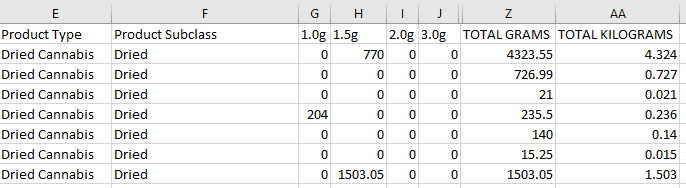
Historical Product Inventory (grams)
A summary of the packaged inventory (in grams) in stock on a given day.
-
Required Filter Fields: None
-
Optional Filter Fields: Start Date
-
Order:
-
Data Points Pulled (per product):
-
The Bulk Lot
- This serves as the source of the packaged inventory.
-
The Bulk Lot's Cannabis Form
-
The Bulk Lot's QA Status
-
The associated product's name
-
The associated product's type
-
The product's subclass
-
Total units in stock per SKU, sorted by net weight
- The report will include a column for each net weight setting.
-
The total grams packaged across all the product's SKUs
-
The total kilograms packaged across all the product's SKUs
-
Click through the other tabs in the Report Types section to access Client Reports, Physician Reports, Order Reports, Complaints Reports, Inventory Reports, Health Canada Reports, Grow Reports, Destruction Reports, and Wholesale Reports.